Published by Thomas Schöps in 2012
Download here! Updated on Feb. 19th 2012: fixes a few bugs and optimizes contour calculation.
The Laserscan tool processes point clouds and generates those nice looking images :) Binaries are provided only for Windows, but the source can also be compiled to run on Linux.
In its current form, this is a very basic command line tool without many options. When it is run on an input file, it will just generate all possible outputs and save them as images. But as it is open source, you are invited to extend it and add your visualization ideas to it!
Currently, the tool only processes classified point clouds which contain ground points and other (object) points. This is because I suppose that there are more than enough programs which handle the ground part alone. Extending the program to support this also would be trivial, though.
The program generates the following visualizations:
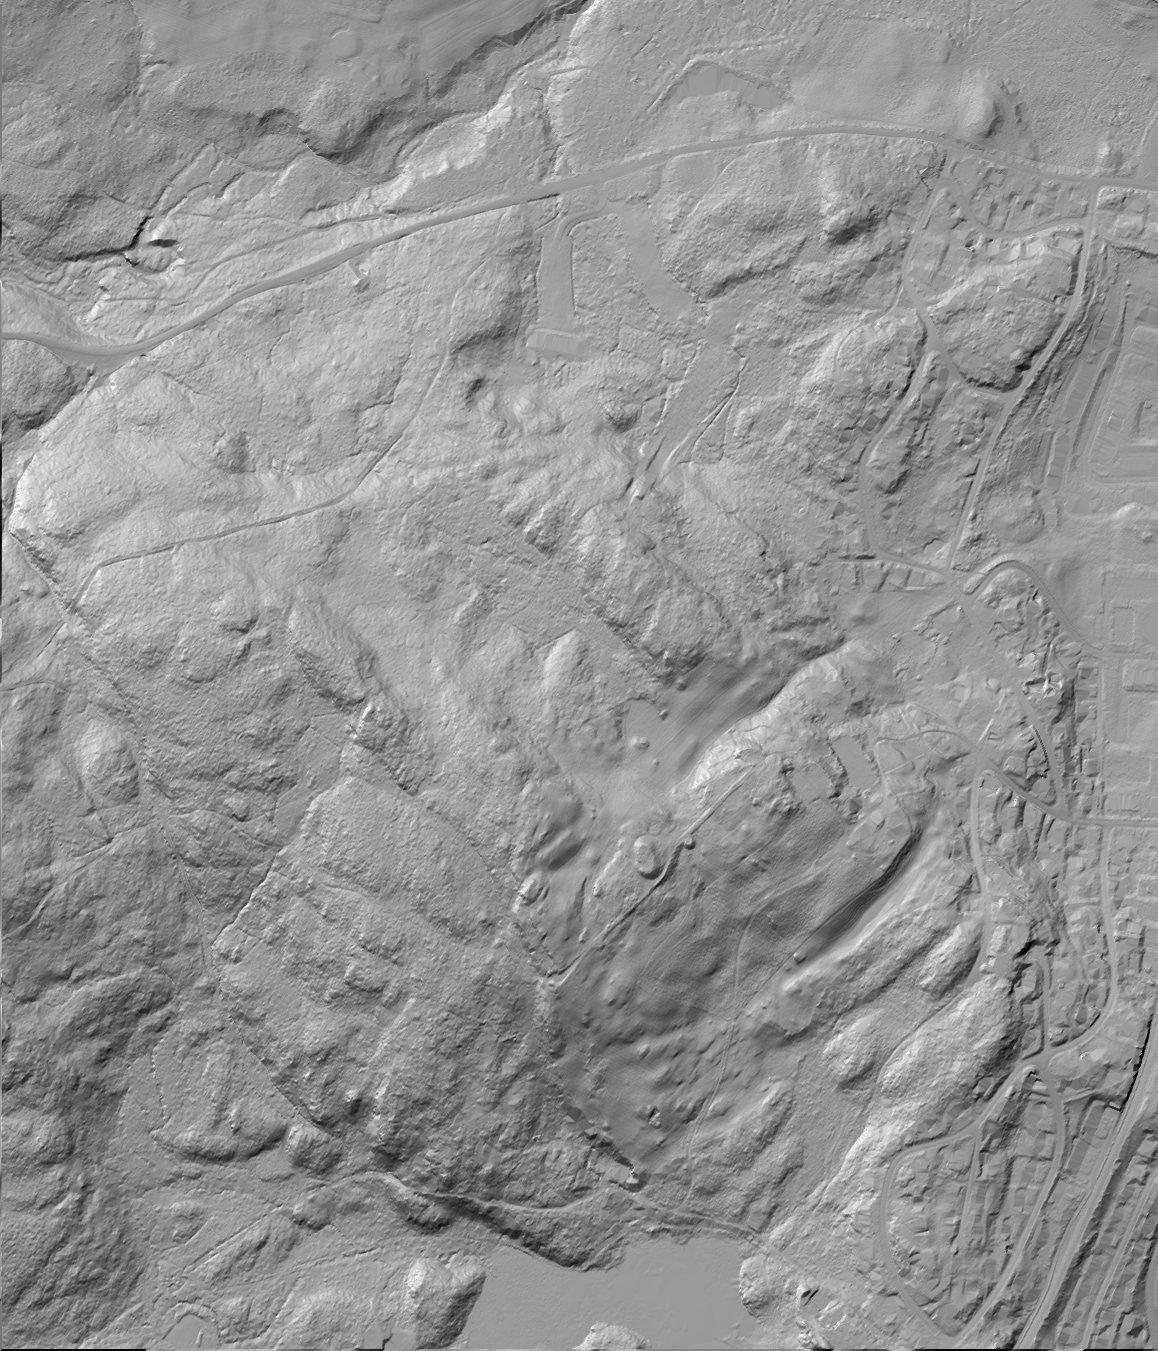
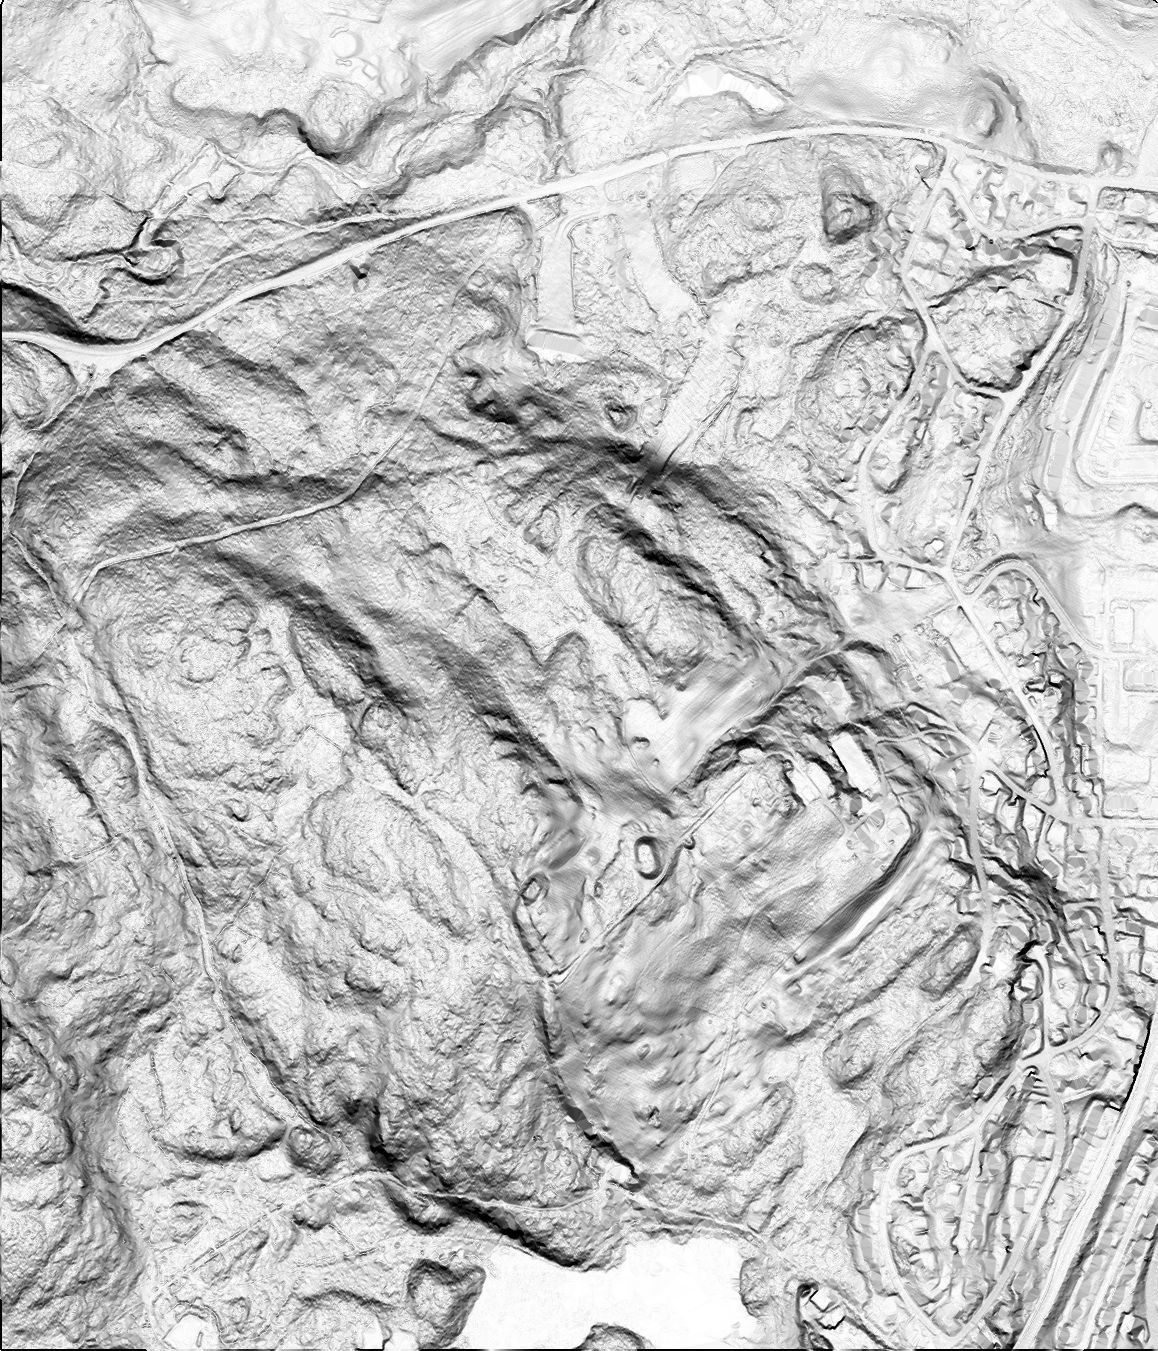
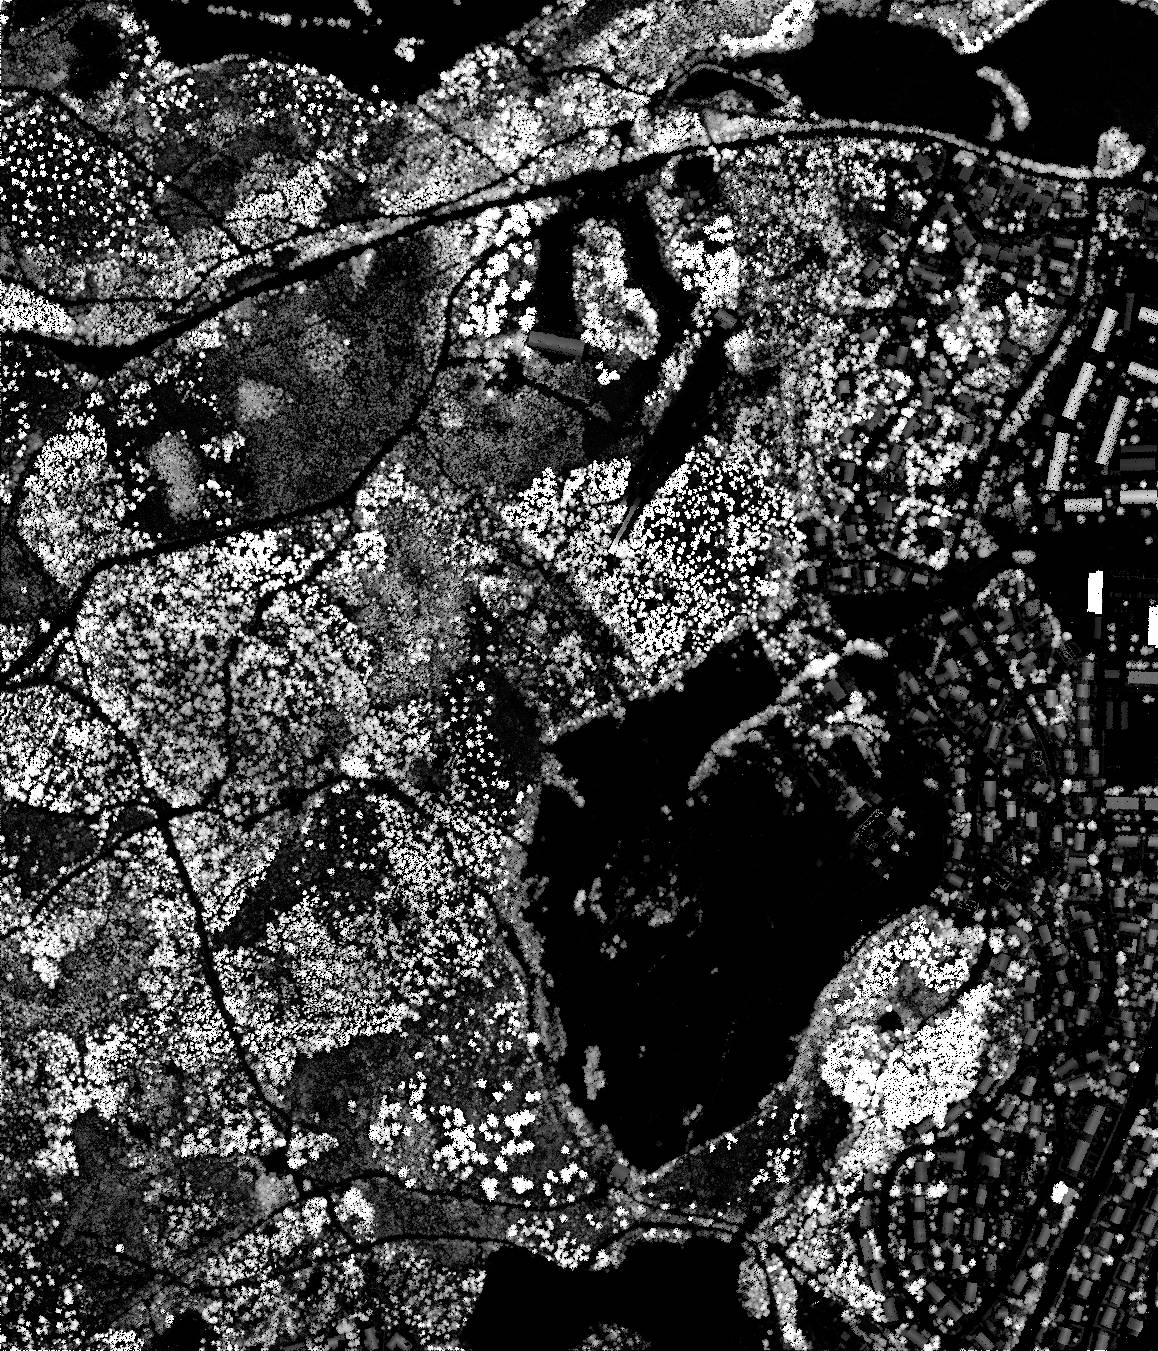
Here are example pictures for the most useful visualizations:
The images are generated from the Trondheim dataset using a pixel distance of 1 meter.